Spectral Risk Measure

Hello David,

I have a clarification on the implication of spectral risk measure. What does it convey?

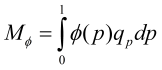
Since we are taking weighted average of of quantiles (weights being calculated as per Dowd's formula' or assigned according to discretion), should I understand the spectral risk measure as the number of standard deviations of returns.

So, if the mean of normal distribution is 20% and the spectral risk measure of .42, what should my understanding be?

If one were to calculate Capital requirements as per spectral risk measure, how to arrive at the required capital?

Your help on this very much appreciated.

Many Thanks,
Vijay.
 

QuantMan2318

Well-Known Member
Subscriber
Dear Vijay

I am not sure that I get your question correctly, but I will endeavour to explain based on my understanding, A spectral risk measure is a type of measure of VAR, that satisfies all the properties of a coherent risk measure ( I assume the VAR to be the quantile ). So taking this definition into account, even the Expected Shortfall is a spectral risk measure as it is a special case of the weight being equal to 1/(1-a) for the confidence level greater than or equal to a and zero otherwise.
So the integral from zero to one, (the area under the normal curve) of the above weight applied to VAR at successive confidence levels and averaged is the ES, so by definition, a spectral risk measure is a weighted average of your VAR at various confidence levels and is thus an average of your Z values if you assume a standard normal not a number of standard deviation of returns, the same thing can be stated for other weights as well, we can chose any weight that approximates our models and therefore instead of the above weight, if we use Dowd's weight, then our quantile or VAR is weighted and summed at various confidence levels according to our risk aversion gamma and the confidence level a, so I can modify your statement as follows:

The mean is zero and the std dev is one ( we are assuming std. normal in the text) and the spectral measure of risk from 10% to 90% confidence level (your 20% was in the confidence level) is 0.42 which means our average of losses is USD 0.42 million
Hope this is correct
Regards
Manikandan V R
 
Dear Manikandan,

Many thanks for your meticulous and ardent effort to clarify my doubt.

Despite your stupendous answer, I am still confused and here is why.

I am still under the impression that the z value is the number of standard deviations from the mean, because if we have to calculate VAR at say for example 99%, we multiply the sd of returns by 2.33, which is the number of sd from mean. Going by that impression if we multiply the z value by weight (calculated by use of gamma to impose risk aversion), then to me it appears that the spectral risk measure is nothing but weighted average number of standard deviations weights being one given by Dowd's formula (Please c/f the screen shot below)

upload_2015-9-29_0-29-32.png


Moreover, if my mean (20% as stated earlier) is also a part of confidence level in the weighting function, then the normal deviate assigned to it will be 0.00 (as it is a mean and will have a CL of 50%) and in that case whatever be the mean of the distribution, that will have no impact in the risk measure because of zero weights. In that case the spectral risk measure will return the same risk measure and as per your logic will have the same loss level for various levels of mean. Albeit we can play around with the gamma factor, but the risk measure is still same for that gamma factor for any level of mean. Hence we can only have a risk measure which can be either scaled up or down by gamma.

So I am still clueless about the implication as I have a risk measure which for me looks like weighted average of SDs. (Do I seem to be a pest as of now:)-


It would be of great help if you could help me again and enlighten me with your understanding.

Looking forward..

Best Regards,
Vijay.
 

QuantMan2318

Well-Known Member
Subscriber
should I understand the spectral risk measure as the number of standard deviations of returns.
Sorry I assumed that your post above meant the number of std. dev of returns. I didn't know that you were implying the weighted average of a number of std. dev of returns at various CLs which is of course correct if returns include losses. Yes you are right, in Normal Distribution, the Z value is the number of std. deviations if there is a mean and the std. dev is other than one, however it also means losses if you assume a standard normal and hence I stated that ES or Spectral Risk Measure is the weighted average of your losses at different confidence levels.

Moreover, if my mean (20% as stated earlier) is also a part of confidence level in the weighting function, then the normal deviate assigned to it will be 0.00 (as it is a mean and will have a CL of 50%) and in that case whatever be the mean of the distribution, that will have no impact in the risk measure because of zero weights. In that case the spectral risk measure will return the same risk measure and as per your logic will have the same loss level for various levels of mean. Albeit we can play around with the gamma factor, but the risk measure is still same for that gamma factor for any level of mean. Hence we can only have a risk measure which can be either scaled up or down by gamma.
Sorry, I don't know how you say the mean is 20%, as all the computations are done assuming std normal distribution with a mean of loss/returns being zero.
(I thought you were referring to the CL of 20%). I don't know what you mean by the mean of 20%, but if there is a mean, i.e the distribution is not standard normal, then the quantile will of course capture both the mean and the std dev. as the mean adjusted VAR, hence our coherent risk measure is the weighted average of the mean adjusted VAR which is again the losses after adjusting for the mean and std dev and hence our spectral risk measure is once more a weighted average of VAR(losses) only. Your mean of losses will appear at the 50% CL and with the weights determined by the weighting function and gamma. Dowd has chosen a gamma that gives zero weights for lower confidence levels. This is my understanding, please do correct me if I am wrong.
 

David Harper CFA FRM

David Harper CFA FRM
Subscriber
Hi @raghavan.analyst The spectral risk measure is a broad class of potential measures. Referring to Dowd Chapters 2 & 3, we can start with the general risk function:
t4_31_3_spectral_measure.png

where the key ingredient is phi(p) which is the risk-aversion function. So I think of general risk function as a big umbrella that can hold an infinite variety of measures; it does not mean much by itself. It just says, the risk measure will be depend on how you want to weight the distributional quantiles.

As @QuantMan2318 implies, a spectral risk measure is just an instance (special case) of this general risk function that meets certain conditions. The most important condition is that the weights are "weakly increasing;" i.e., they do not decrease as the quantile increases. In your pasted example, the weights are increasing; this reflects a spectral risk measure (which is coherent, by definition).

But the spectral risk measure is still a broad class; it includes the expected shortfall, but is hardly limited to ES. In brief:
  • Due to its broad nature, almost any risk measure (that I can think of) is a variation on the general risk function above, which is simply some kind of weighted quantile. Even the standard deviation itself can be argued as a special case: it has weight = 1 at the quantile corresponding to to 1.0 standard deviation, and zero at all other quantiles
    • VaR is a special case of the this general risk function
    • ES is a special case of this general risk function
  • A spectral risk function is a special case of this general risk function, which has conditions on the weighting function. Intuitively, it expects us to dread greater losses more than smaller losses (or, at least, it does not expect us to favor smaller losses!)
    • VaR is not spectral because it doesn't meet the weakly increasing weighting criteria. VaR is a general risk function but not spectral (and not coherent)
    • ES is spectral and therefore must also be a general function
Your pasted example above is not ES, it is a spectral risk function which employs an (expected) certain weighting function that increases. There is nothing magic about the illustrated weighting function. It's attractive because it gives zero to gains and escalates rapidly in the tail. It has no necessary link to standard deviation or ES (the VaRs are just distributional quantiles, the term "VaR" is here really only because we are slicing the distribution into discrete quantiles, and VaR is just a quantile).

Further, as the spectral risk measure is continuous, your pasted example above is an illustration of estimating the spectral by discretely slicing the distribution into quantiles. Dowd shows the ES can be similarly estimated, but when he estimates ES the weights are identical (ES is a plain old conditional weighted average)! In your exhibit, the weights are increasing. I hope that helps to set up the framework, thanks!
 
Last edited:

David Harper CFA FRM

David Harper CFA FRM
Subscriber
Hi @raghavan.analyst It is 0.42 standard deviations; e.g., as the distribution is assumed normal, if the mean is zero and the standard deviation is $100, it represents a risk metric of $42 dollars. But, as Table 3.4 shows, using only 10 quantiles (VaRs) to estimate the true risk metric, in this case, is a terrible estimate. The true risk metric for this weighting function (as an input into the spectral risk measure) is about 1.854; e.g., $185 if the standard deviation is $100. So this 0.42 is not useful; Dowd is merely showing that the continuous weighting can be estimated by slicing up the quantiles, but we'd want more (VaR) quantiles.

Compare the 1.854, just for example, to the 95% ES for a standard normal which is about 2.06. Or the 90% ES which is 1.76. Or the 99% ES which is 2.67. Hopefully you can see why ES needs a confidence level but this weighting function does not: ES is an equally weighted average of the tail; this weighting function applies across the entire distribution but it smart enough to give zero to the gains (btw, a 50% ES is about 0.798).

All of these numbers (e.g., 1.854 for the above spectral measure which is grossly underestimated by a 10-slice 0.42; 2.06 for the 95% ES) apply to the same standard normal distribution, which is used merely to illustrate the idea. They are intended for other distributions. What they have in common is that they are each an attempt to summarize the distribution into a single metric of risk. For example, if we had an unrealistic distribution which only achieved gains, all of the methods (VaR or ES at 9x%, this spectral measure) would return a risk metric of zero. The difference arise due to a perspective (aversion) to the nature of the tail. Thanks,
 
Thanks David for your answer which is really impressive as always..

So if I had understood it correctly,

If we had sliced the distribution into more granular slices to get a value of 1.854, did you mean to say that this value of 1.854 will be the same across the board and its only the standard deviation of the distribution which will decide on the risk metrics.

For example ;
If I were to calculate the risk metrics for the below 2 instruments;

1. FX contracts with the SD of returns equal to $ 150000
2. Options on Stocks with the SD of returns equal to $ 250000

If I use Dowd's method of risk metric but with more granular slices which is 1.854, will I have a risk metric of $150000*1.854 for FX and $ 250000*1.854 for Options.

Many Thanks in advance.

Vijay
 

David Harper CFA FRM

David Harper CFA FRM
Subscriber
Hi @raghavan.analyst That is an interesting question! You could do that but probably you do not want to do that because in doing so you've made a big assumption. The 1.854 is the output value for this weighting function when we apply it to the standard normal distribution; e.g., =norms.inv(0.90) = 1.282 is a normal 90% quantile value. Just to compare, for 5 d.f. the 90% quantile for the student's t distribution is t.inv(0.90, 5) = 1.476; there is a different 90% quantile for each distribution! If the distribution for both your FX and options did happen to be approximately normal, then your approach would be correct ...

But if they are not normal--and they probably are not--then you need the risk measure for their appropriate, respective distributions. The mechanics above would be the same, but the output standard deviation would be different.

Your question illustrates a common problem, or mis-perception in some cases: a standard deviation by itself does not imply the normal distribution. In practice, we sometimes just compute the first two moments (mean and standard deviation) and implicity--to use Linda Allen's phrase--we "impose normality" incorrectly. The central limit theorem (CLT) justifies imposing normality on the mean, because sample means converge to normal distribution. But estimating risk measures has almost nothing to do with the mean, and everything to do with the tail. Further, we are probably using these measures (i.e., spectral risk measures) in the first place precisely because the data is not normal ... so, we probably cannot do what you suggest because we instead need to run column (A) above, not for normal deviates, but to retrieve the deviates for the relevant distributions that apply to FX and options. I hope that helps!
 
Last edited:

David Harper CFA FRM

David Harper CFA FRM
Subscriber
HI @bpdulog Spectral is the (very) general risk measure with three conditions applied (the most important being risk aversion: "The critical condition is the third one. This condition reflects the risk-aversion, requiring that the weights attached to higher losses should be bigger than, or certainly no less than, the weights attached to lower losses. Given that it ensures coherence, this condition suggests that the key to coherence is that a risk measure must give higher losses at least the same weight as lower losses.). Dowd like expected shortfall, but he also likes the "spectral–exponential measure" which he introduces on page 40 of https://forum.bionicturtle.com/resources/kevin-dowd-measuring-market-risk.87/

... The ultimate source for Dowd's spectral measure is the original paper here http://trtl.bz/lib-T5-spectral-measures-orig
 

QuantFFM

Member
HI @bpdulog Spectral is the (very) general risk measure with three conditions applied (the most important being risk aversion: "The critical condition is the third one. This condition reflects the risk-aversion, requiring that the weights attached to higher losses should be bigger than, or certainly no less than, the weights attached to lower losses. Given that it ensures coherence, this condition suggests that the key to coherence is that a risk measure must give higher losses at least the same weight as lower losses.). Dowd like expected shortfall, but he also likes the "spectral–exponential measure" which he introduces on page 40 of https://forum.bionicturtle.com/resources/kevin-dowd-measuring-market-risk.87/

... The ultimate source for Dowd's spectral measure is the original paper here http://trtl.bz/lib-T5-spectral-measures-orig

Hi David,
so i'm starting next round for part II.

Can you please explain why a spectral risk measure is always coherent? If the green marked conditions above are met, all four conditions for coherence are met too? But why?

Many Thanks in advance
 

David Harper CFA FRM

David Harper CFA FRM
Subscriber
Hi @QuantFFM Sorry for delay, I was at a conference Wed to Friday. Good luck on starting the next round for part II! Coherence does require all four of its conditions, but as Dowd explains, three of the four are are "essentially 'well-behavedness' conditions intended to rule out awkward outcomes." For example, monotonicity requires that if Y ≥ X then ρ(Y) ≤ ρ(X); ie, if the expected value of portfolio Y completely dominates the expected value of portfolio X, then Y is less risky than X according to the measure. In this way, I don't think the spectral measure has a unique claim on validating three of the four coherence properties; many measures would already do that. The key requirement among the coherence properties is the sub-additivity requirement. So the context here is how spectral (as a special case of the general risk function) qualifies a coherent measure, but the specific association is between the weakly-increasing criteria (of spectral) that ensures the subadditive criteria (of coherence).

Now the general risk function (see above https://forum.bionicturtle.com/threads/spectral-risk-measure.8883/#post-37571 ) is just an abstract vehicle because it just weights the quantiles of the distribution, where the weight can be any function. So the general risk function is a wonderfully blank slate. A spectral risk measure is a special case of the general risk measure, but two of its three conditions are somewhat trivial; e.g., non-negativity is simply requiring positive weights. In this way, it is the weakly increasing condition applied to the general risk function that renders it coherent because this satisfies subadditivity. I have copied Dowd's fine explanation of this connection below. But his two-bond example is a helpful concrete illustration of why this connection makes sense. If we have two independent bonds each with PD of 4.0%, then their individual 95.0% VaRs are zero because the 95.0% VaR (as a special case of the general risk function) applies all of its weight to the 0.95 quantile (where the bond does not default) and zero weight to the 0.96 or 0.97 or 0.98 quantiles (where losses are incurred). When the two bonds are combined, the 0.95 quantile is associated with a loss, however counterintuitively the VaR risk measure as a summation of the two independent variables is zero = zero + zero. The fact that the VaR risk measure gives zero weight to quantiles above the 0.95 quantile produces awkward (i.e, non subadditive) results when the components are combined. The condition for weakly increasing weights thusly ensures that the risk measure will not be awkwardly anti-diversifying (i.e., will not penalize for diversification) when components are combined. I hope that's helpful, the emphasis in Dowd's text below is mine.

The first two conditions [i.e., non-negativity and normalization] are fairly obvious as they require that weights should be positive and sum to 1. The critical condition is the third one [weakly increasing]. This condition reflects the risk-aversion, requiring that the weights attached to higher losses should be bigger than, or certainly no less than, the weights attached to lower losses. Given that it ensures coherence, this condition suggests that the key to coherence is that a risk measure must give higher losses at least the same weight as lower losses.

The weights attached to higher losses in spectral risk measures are thus a direct reflection of the user’s risk-aversion. If a user has a ‘well-behaved’ risk-aversion function, then the weights will rise smoothly, and the rate at which the weights rise will be related to the degree of risk aversion: the more risk-averse the user, the more rapidly the weights will rise. This is exactly as it should be.

The connection between the φ(p) weights and risk-aversion sheds further light on the inadequacies of the ES and the VaR. We saw earlier that the ES is characterised by all losses in the tail region having the same weight. If we interpret the weights as reflecting the user’s attitude toward risk, these weights imply that the user is risk-neutral between tail-region outcomes. Since we usually assume that agents are risk-averse, this would suggest that the ES is not, in general, a good risk measure to use, notwithstanding its coherence. If a user is risk-averse, it should have a weighting function that gives higher losses a higher weight.

The implications for the VaR are much worse, and we can see that the VaR’s inadequacies are related to its failure to satisfy the increasing-weight property. With the VaR, we give a large weight to the loss associated with a p-value equal to α, and we give a lower (indeed, zero) weight to any greater loss. The implication is that the user is actually risk-loving (i.e., has negative risk-aversion) in the tail loss region.22 To make matters worse, since the weight drops to zero, we are also talking about risk-loving of a very aggressive sort. The blunt fact is that with the VaR weighting function, we give a large weight to a loss equal to the VaR itself, and we don’t care at all about any losses exceeding the VaR! It is therefore hardly surprising that the VaR has its problems."
 

[email protected]

Active Member
Hi David,
Can you share a spreadsheet (if you have one!) showing how the 2 bonds combine?
Thanks

[But his two-bond example is a helpful concrete illustration of why this connection makes sense. If we have two independent bonds each with PD of 4.0%, then their individual 95.0% VaRs are zero because the 95.0% VaR (as a special case of the general risk function) applies all of its weight to the 0.95 quantile (where the bond does not default) and zero weight to the 0.96 or 0.97 or 0.98 quantiles (where losses are incurred). When the two bonds are combined, the 0.95 quantile is associated with a loss, however counterintuitively the VaR risk measure as a summation of the two independent variables is zero = zero + zero. The fact that the VaR risk measure gives zero weight to quantiles above the 0.95 quantile produces awkward (i.e, non subadditive) results when the components are combined. The condition for weakly increasing weights thusly ensures that the risk measure will not be awkwardly anti-diversifying (i.e., will not penalize for diversification) when components are combined. I hope that's helpful, the emphasis in Dowd's text below is mine.
 
Last edited by a moderator:

David Harper CFA FRM

David Harper CFA FRM
Subscriber
HI @[email protected] Sure, it's already in the learning XLS associated with Dowd Chapters 3 & 4, see R35 XLS at https://learn.bionicturtle.com/topic/learning-spreadsheet-dowd-chapter-3/
The sheet is currently labelled "5d.1 VaR not Subadditive" (see shot below) although, FYI, we are today publishing the new Dowd Chapter 4 (already published new Dowd Chapter 3) and so I'll be publishing a revision to this XLS is coming weeks (but it will still contain this bond subadditive example, just a bit more user friendly). Thanks!

0207-dowd-2bond-subadditive.jpg
 
Top