sipanivishal
Manager-Corporate Banking
Hi David,
I have heard that they provide quantiles for each section,so if the questions are mixed then how do they evaluate individual quantile ? Moreover pass and fail depends on overall marks or one has to clear cut offs in each section ?
Thanks
Sipani
I have heard that they provide quantiles for each section,so if the questions are mixed then how do they evaluate individual quantile ? Moreover pass and fail depends on overall marks or one has to clear cut offs in each section ?
Thanks
Sipani
 imo), please see
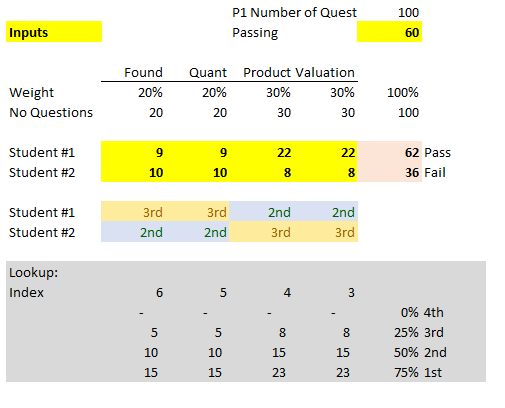


")